VINAYAK HIREMATHWelcome to My Portfolio!About Me:Driven and Results Oriented Data Analyst with 2+ years of experience in leveraging MS Excel, Google Sheets, Power BI, Google Analytics-4, and Looker Studio. Skilled in data cleaning, transformation, and visualization to extract insights and drive business decisions. I am eager to apply my skills to contribute to a dynamic team and support data-driven decision-making.."Unlocking the power of data to derive meaningful insights"
Key Projects - Power BI, Advanced Excel, SQL
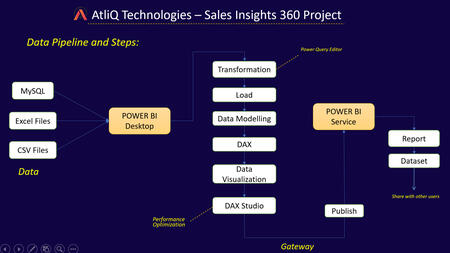
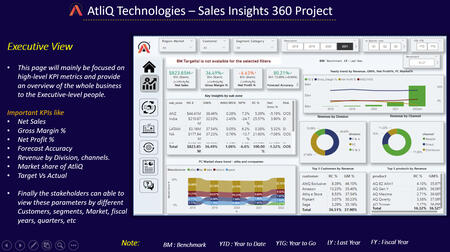
Sales Insights 360 Project - POWER BI | MySQL | DAXThis Project is mainly focused on providing the sales insights to AtliQ Technologies and enabling them to make data driven decision making, which aims to scale the business by 10% and also to monitor the overall trend of sales across diffrent markerts channels and divisions.• Designed a multi-view comprehensive Power BI dashboard for various departments including (Finance, Sales, Marketing, and Supply chain) of AtliQ technologies to understand trends and facilitate data-driven decision-making, which aimed to scale the business process by 10%.
• Transformed and wrangled over 1.8 million records from different data sources ( MySQL, Excel, and CSV)
• Used Dax Studio for performance optimization and achieved 10% performance improvement.
• Validated the data against benchmarks provided by stakeholders and also worked on requests from different department leads.
.GitHubLive Dashboard
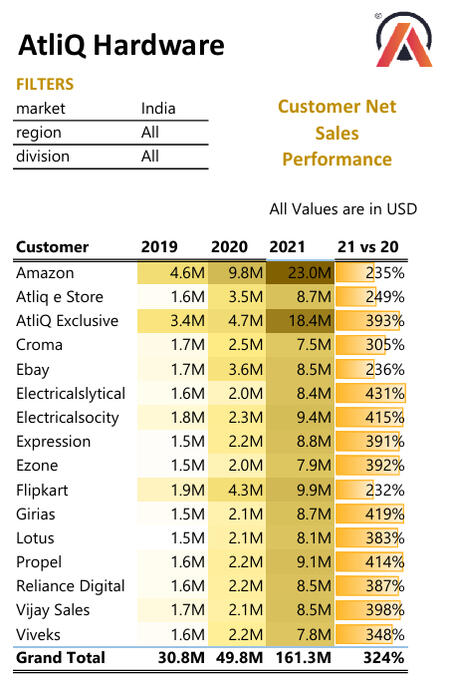
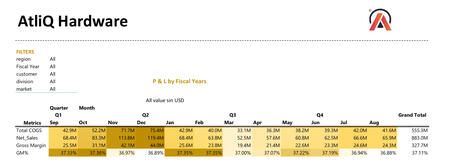
Sales and Finance Analytics - AtliQ Technologies - Advanced EXCEL This Project focuses on AtliQ hardware's Customer Net sales performance and Profit & Loss report for the Fiscal year 2019 to 2021 and provides insights to drive business decisions.Steps and Key Takeaways:
• Extracted and transformed the data of more than 1 million records using Power Query and utilized PowerPivot for data modelling, DAX functions, and measures to get the required business KPIs.
• Created the sales and Finance analytics report for AtliQ Technologies for Fiscal Year (FY) 2019 to 2021 focusing on Net sales, Market performance, year-wise growth in Gross margin %, and P&L statement.
• Identifying the highest Net Sales for Amazon and AtliQ exclusive customers of 18.4 and 23 million respectively and also the Gross margin% has declined from 41.43% in 2019 to 36.43% in 2021.
.Github Link
Web Application Users - Data Analysis - SQL | SSMS | CTE This analysis is focused on web application users' activity and login details, analysing the overall details and answering the specific quetions posed by the management to drive the business decisions and understand thr users in detailSpecific Quetions answered though the Analysis
a. Mnagement wants to see all the users that did not login in the past 5 months ?
b. For the Business Units quarterly anaysis, calculate how many users and how many sessions were at each quarter ?
c. Display userid's that login in Jan 2024 and did not log in in nov 2023. ?
d. percentage change in sessions from last quarter session count, user count, quarterfirstdate ?
e. Display the user that had the highest session score for each day ?
f. To identfy our best users - Return the users that had a session on every single day since thier first login ?
g. on what dates there were no login at all ? Github Link

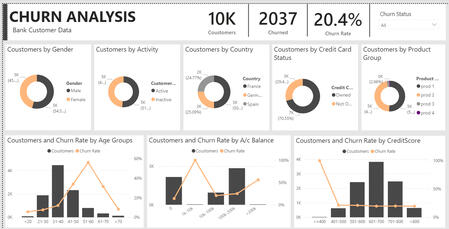
CHURN ANALYSIS - POWER BIThe Main Objective of creating this report is to analyze the churn rate of bank customers and understand the different parameters and take the action to reduce the churn rate and providing best service to the customersKey Takeways:
• Utilized Power Query editor to transform and clean the data and utilized DAX functions to get the required KPIs.
• Analysed the churn rates by different age groups, and credit scores, and based on the account balance.
• Customers aged 51-60 have the highest churn rate of 56.2%, while customers aged <20 have a churn rate of 5.6%.
• Customers having credit scores <400 have a 100% churn rate & maintain the A/C balance between 1k to 10k.
.Github Link